Geographic Information Systems
 tech.michaelaltfield.net
# Make Vector Topographic Maps (Open Street Map, Maperitive, and Inkscape) #### by Michael Altfield This guide will show you how to [generate vector-based **topopgraphic maps**](https://tech.michaelaltfield.net/2024/10/01/osm-contours-svg-maperitive/), for printing very large & **high-quality paper wall maps using inkscape**. All of the tools used in this guide are free (as in beer). | [](https://tech.michaelaltfield.net/2024/10/01/osm-contours-svg-maperitive/) | |:--:| | How-to [Guide to Making Vector Topo Maps](https://tech.michaelaltfield.net/2024/10/01/osm-contours-svg-maperitive/) with Maperitive and Inkscape | # Intro I recently volunteered at a Biological Research Station located on the eastern slopes of the Andes mountains. If the skies were clear (which is almost never, as it\'s a cloud forest), you would have a great view overlooking the Amazon Rainforest below. | [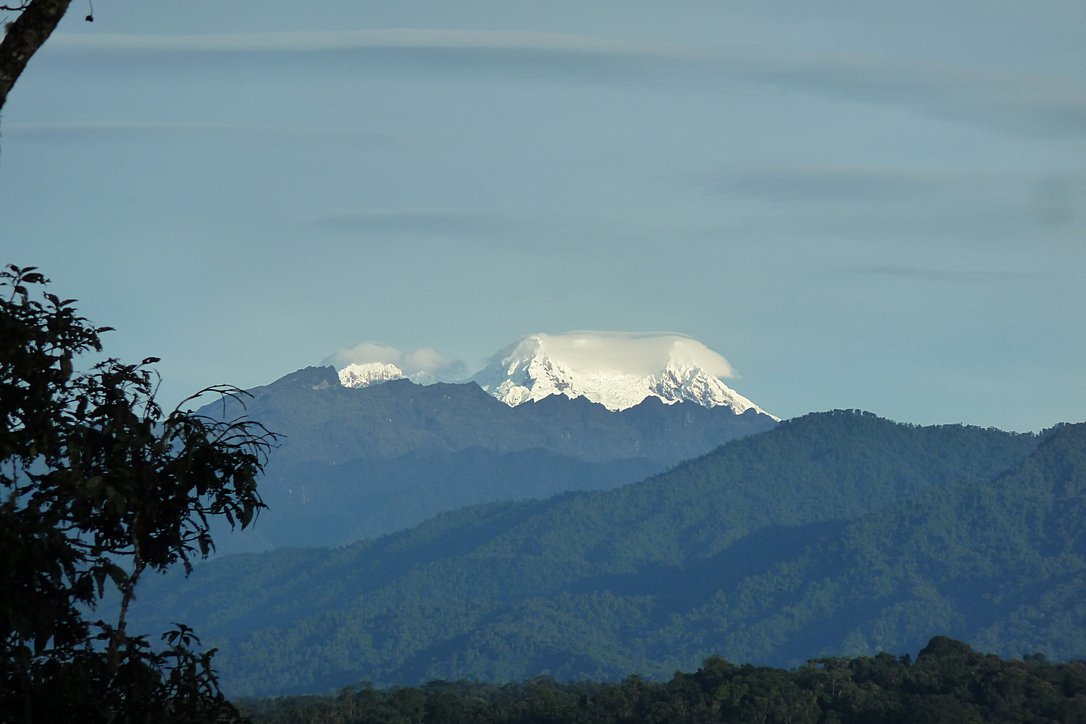](https://tech.michaelaltfield.net/2024/10/01/osm-contours-svg-maperitive/) | |:--:| | Yanayacu is in a cloud forest on the east slopes of the Andes mountains, just 30 km from the summit of the glacial-capped [Antisana](https://en.wikipedia.org/wiki/Antisana) volcano ([source](https://commons.wikimedia.org/wiki/File:Volc%C3%A1n_Antisana_2015-06-14_(9)_(39680659444).jpg)) | The field station was many years old with some permanent structures and a network of established trails that meandered towards the border of Antisana National Park -- a protected area rich with biodiversity that attracts biologists from around the world. At the top of the park is a glacial-capped volcano with a summit at 5,753 meters. Surprisingly, though Estacion Biologicia Yanayacu was over 30 years old, nobody ever prepared a proper map of their trails. And certainly there was no high-resolution topographical map of the area to be found at the Station. That was my task: to **generate maps that we could bring to a local print shop to print-out huge 1-3 meter topographical maps**. And if you want to print massive posters that don\'t look terrible, you\'re going to be working with **vector graphics**. However, most of the tools that I found for browsing Open Street Map data that included contour lines couldn\'t export an SVG. And the tools I found that *could* export an SVG, couldn\'t export contour lines. It took me several days to figure out how to render a topographical map and **export it as an SVG**. This article will explain how, so **you can produce a vector-based topographical map in about half a day** of work. ## Assumptions This guide was written in 2024, and it uses the following software and versions: 1. Debian 12 (bookworm) 2. OsmAnd\~ v4.7.10 3. JOSM v18646 4. Maperitive v2.4.3 5. Inkscape v1.2.2 ## The Tools Unfortunately, there\'s no all-in-one app that will let you just load a slippy map, zoom-in, draw a box, and hit \"export as SVG\". We\'ll be using a few different tools to meet our needs. | [](https://tech.michaelaltfield.net/2024/10/01/osm-contours-svg-maperitive/) | |:--:| | [OsmAnd](https://osmand.net/) | ### OsmAnd [OsmAnd](https://osmand.net/) is a mobile app. We\'ll be using OsmAnd to walk around on the trails and generate GPX files (which contain a set of GPS coordinates and some metadata). We\'ll use these coordinates to generate vector lines of a trail overlaying the topographic map. If you just want a topographic map without trails (or your trails are already marked on OSM data), then you won\'t need this tool. In this guide we\'ll be using OsmAnd, but you an also use other apps \-- such as [Organic Maps](https://organicmaps.app/), [Maps.me](https://maps.me/), or [Gaia](https://www.gaiagps.com/). | [](https://tech.michaelaltfield.net/2024/10/01/osm-contours-svg-maperitive/) | |:--:| | [JOSM](https://josm.openstreetmap.de/) | ### JOSM [JOSM](https://josm.openstreetmap.de/) is a java-based tool for editing Open Street Map data. We\'ll be using JOSM to upload the paths of our trails (recorded GPX files from OsmAnd) and also to download additional data (rivers, national park boundary line, road to the trailhead, etc). We\'ll then be able to combine all of this data into a larger GPX file, which will eventually become vector lines overlaying the topographic map. You can skip this if you just want contour lines without things like rivers, roads, trails, buildings, and park borders. ### View Finder Panoramas Have you ever wondered how you can zoom-in almost anywhere in the world and see contour lines? I always thought that this was the result of some herculean effort of surveyors scaling mountains and descending canyons the world-over. But, no \-- it\'s a product of the US Space Shuttle program. In the year 2000, an international program called [SRTM (Shuttle Radar Topography Mission)](https://en.wikipedia.org/wiki/Shuttle_Radar_Topography_Mission) was launched into space with the Endaevor Space Shuttle. It consisted of a special radar system tethered to the shuttle with a 60 meter mast as it orbited the earth. | [](https://tech.michaelaltfield.net/2024/10/01/osm-contours-svg-maperitive/) | |:--:| | This illustration shows the Space Shuttle Endeavour orbiting \~233 kilometers above Earth. The two anternae, one located in the Shuttle bay and the other located on a 60-meter mast, were able to penetrate clouds, obtaining 3-dimentional topographic images of the world\'s surface (source: [NASA](https://commons.wikimedia.org/wiki/File:Shuttle_Radar_Topographic_Mission_(SRTM)_Illustration.jpg)) | When the shuttle returned to earth, the majority of our planet\'s contours were mapped. This data was placed on the public domain. Today, it is the main data source for elevation data in most maps. While the data from SRTM was a huge boon to cartographers, it did have some gaps. Namely: elevation data [was missing](https://en.wikipedia.org/wiki/Shuttle_Radar_Topography_Mission#No-data_areas) in very tall mountains and very low canyons. Subsequent work was done to fill-in these gaps. One particular source that ingested the SRTM data, completed its gaps, and made the results public is Jonathan de Ferranti\'s [viewfinderpanoramas.org](https://viewfinderpanoramas.org/Coverage%20map%20viewfinderpanoramas_org3.htm). We will be downloading [`.hgt`](https://stackoverflow.com/questions/357415/how-to-read-nasa-hgt-binary-files) files from View Finder Panoramas in order to generate vector contour lines for our topographical map. | [](https://tech.michaelaltfield.net/2024/10/01/osm-contours-svg-maperitive/) | |:--:| | [Maperitive](http://maperitive.net/) | ### Maperitive [Maperitive](http://maperitive.net) is a [closed-source](http://maperitive.net/docs/FAQ.html#Where%20is%20the%20source%20code?) .NET-based mapping software (which runs fine in Linux with [mono](https://www.mono-project.com/)). We\'ll be using Maperitive to tie together our GPX tracks, generate contour lines, generate hillshades, and export it all as a SVG. | [](https://tech.michaelaltfield.net/2024/10/01/osm-contours-svg-maperitive/) | |:--:| | [Inkscape](https://inkscape.org/) | ### Inkscape [Inkscape](https://inkscape.org/) is a cross-platform app for artists working with vector graphics. We\'ll be using inkscape to make some final touches to our vector image, such as hiding some paths, changing their stroke color/shape/thickness, and adding/moving text labels. Finally, we\'ll use inkscape to export a gigantic, high-definition `.png` raster image (to send to the print shop). # Guide To read the full guide on how to create vector-based maps, [click here](https://tech.michaelaltfield.net/2024/10/01/osm-contours-svg-maperitive/): * [tech.michaelaltfield.net/2024/10/01/osm-contours-svg-maperitive](https://tech.michaelaltfield.net/2024/10/01/osm-contours-svg-maperitive/) # Example Maps For example, here\'s the (A4-sized) topo map that I built for Yanayacu. | [](https://tech.michaelaltfield.net/2024/10/01/osm-contours-svg-maperitive/) | |:--:| | Final (raster) export, ready for sending to the print shop ([source svg](https://github.com/maltfield/yanayacu/blob/main/maps/yanayacu_topo/yanayacu_topo.svg)) | Note that I changed the stroke and thickness of the National Park boundary to be large and green, I changed the path of the road (downloaded from OSM data in JOSM) to be thick and black, and I changed my GPX tracks (recorded in OsmAnd and merged with the OSM data in JOSM) to be thin, dashed, and red. The source `.svg` file for the above image can be found [here](https://github.com/maltfield/yanayacu/tree/main/maps/yanayacu_topo) - [github.com/maltfield/yanayacu/tree/main/maps/yanayacu_topo](https://github.com/maltfield/yanayacu/tree/main/maps/yanayacu_topo) I also used this method to generate a simplified \"trail map\" of Yanayacu (without contour lines). The workflow was similar, except I didn\'t generate contour nor hillshades layers in Maperitive before exporting as a `.svg` | [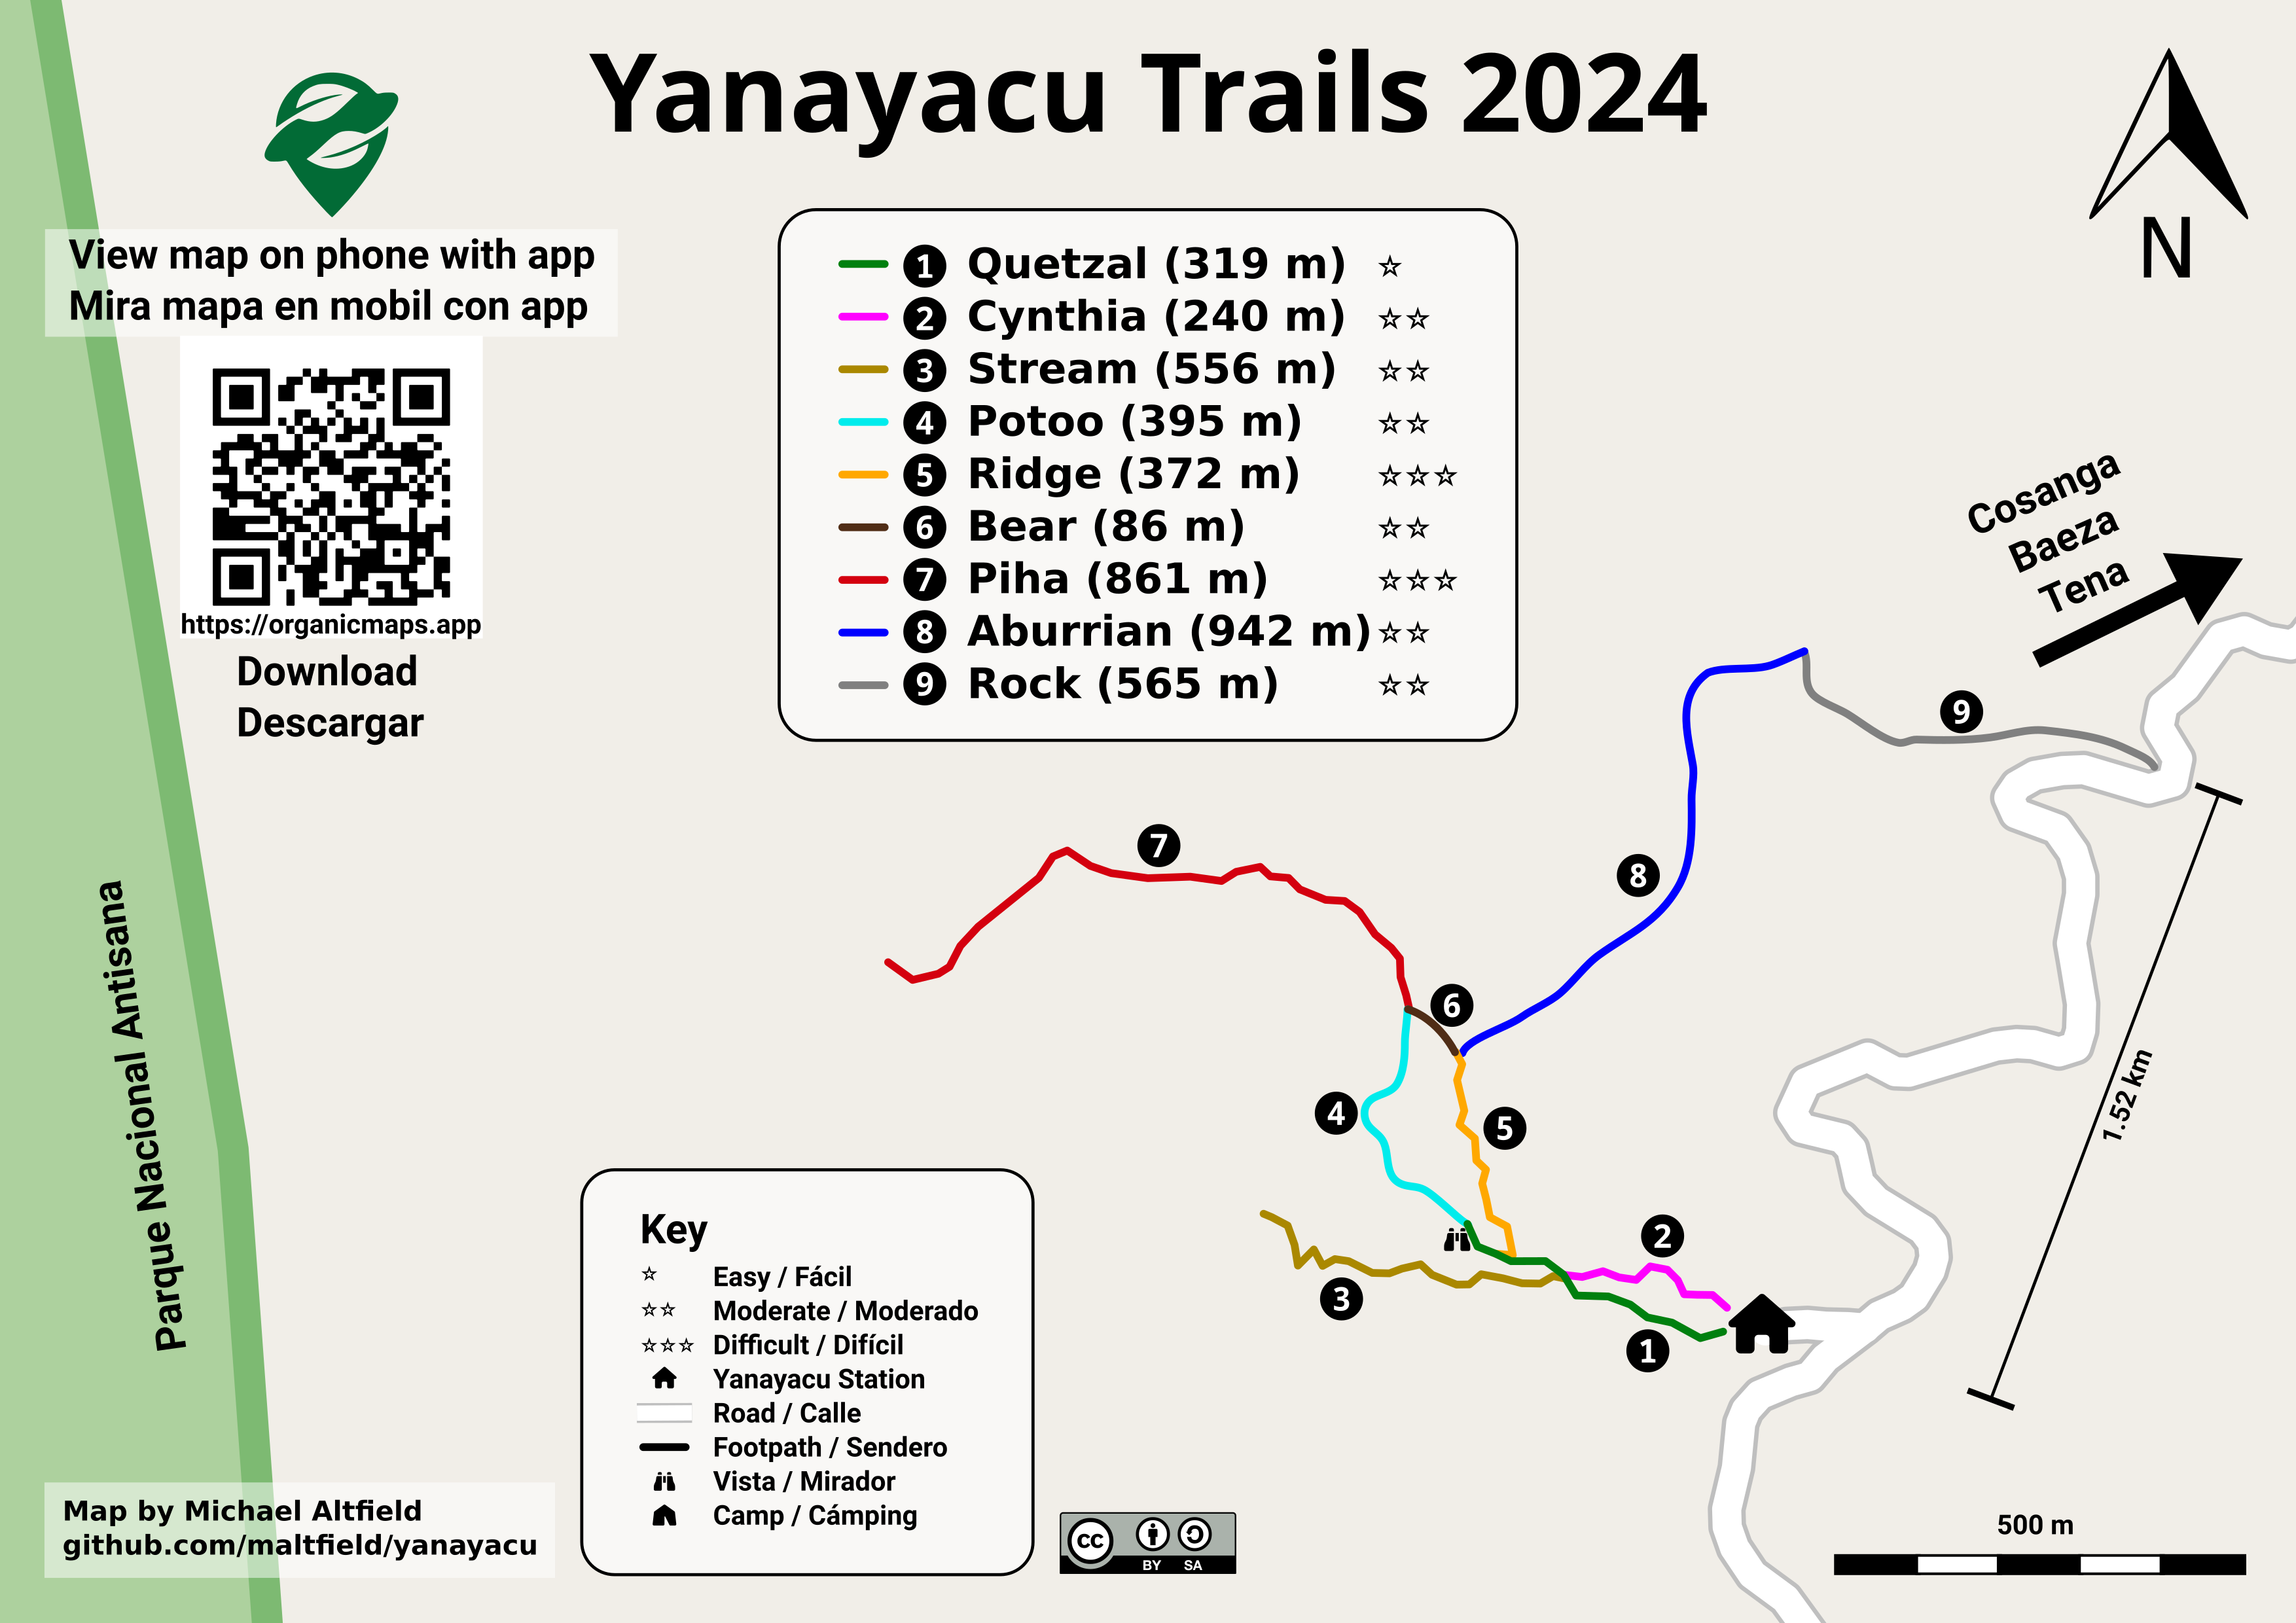)](https://tech.michaelaltfield.net/2024/10/01/osm-contours-svg-maperitive/) | |:--:| | Yanayacu Trail Guide ([source svg](https://github.com/maltfield/yanayacu/blob/main/maps/yanayacu_trail_guide/yanayacu_trail_guide.svg)) | The source `.svg` file for the above image can be found [here](https://github.com/maltfield/yanayacu/tree/main/maps/yanayacu_trail_guide) - [github.com/maltfield/yanayacu/tree/main/maps/yanayacu_trail_guide](https://github.com/maltfield/yanayacu/tree/main/maps/yanayacu_trail_guide)
On the assumption that I know C++/Qt, and python/pyside already, and have a geospatial and open source background -- but have never dug into the internals of QGIS in any capacity? Thinking of writing import plugins for geophysical data (things like ground penetrating radars and such).
I'm already proficient in Linux, Python, Java, web development etc from college, but what GIS specific APIs or frameworks should I focus on for my portfolio? Right now my job consists entirely of Esri products but I'd like to change that. Thanks!
I'm curious why did you all chose GIS as a career, as is a "niche" field. It's widely used but not much people know about it. In my case I studied History & Geography and had to use GIS during one course. I really liked it and I also like to code, so I guessed GIS could be a career for me as I didn't want to be a teacher back then. I'm now finishing a GIS Maters and working as a GIS analyst, using python to automate routines. Is my first job in the field (started as an intern).
Reddit refugee here. I really liked that rule in r/GIS as it helps keep people informed about if the job is serious or not.
For those who've wandered in here, you may have noticed the recent spat of bot postings. What's your take on that? Just can the postings and ban the user? I think I'll probably do that preemptively right now, but I'm curious what experience or thoughts the rest of you have.
Hey y’all! I’m set to graduate with a degree in GIS and Computer Science this upcoming December, and I’m wondering if y’all know of any areas in the US that have a lot of potential for someone newly entering the GIS field. My area (Dallas/Fort Worth area) seems to only have job postings for city level government jobs that pay the same or worse than my current part time tech support job, or corporate jobs that say you need to know 12 different softwares with 8 years of experience. Ideally, I’d like a GIS technician position, and I’d like to get into remote sensing, conservation, or research, but I recognize beggars can’t always be choosers when entering a new field. If y’all have any input, it’d be greatly appreciated. Thanks!
Hi folks! I got through my first round of interviews with the program manager for a GIS analyst role. They asked briefly about my GIS technical skills and experience, my current work and why I was leaving, my interests, what kind of data I’ve worked with, salary expectations, went over the role, and company culture. I now have an interview with both the program manager and the lead. I’m not sure what to expect since we went over a little bit of everything in the first round. What questions should I get ready for next? I’m thinking I might need to recap my technical skills and salary expectations again, but not sure after that.
I have a parcel layer that contains private information that I’m okay with sharing internally at my organization, however I also want to share the same layer publicly. If it was a hosted feature layer I would be able to create a view layer, but since it’s a referenced layer that’s not available to me. The layer gets regularly updated so if I make it a hosted feature layer I’ll have to update in two different places every time and I would like to avoid that. Do you guys have any suggestions? Thanks in advance!
Is it possible to use newer satellite imagery for a Basemap in ArcGIS Pro, specifically for SEUSA/Florida?
I am currently working on a research project that requires using an attached excel sheet for the options within a drop down selection. My supervisor has adjusted every setting within her preview yet the drop down box to select from remains empty. From her end she is able to see the options within the drop down box but no other user within the group are able to see them. It is beginning to feel more like a bug than something we are doing on our end setting-wise. For complete transparency, none of us are very familiar with the program so any and all guidance is appreciated.
I am trying to figure out the area covered by forest for my study area using 2 different satellite images for accuracy i.e., Sentinel-2 and Landsat 8. I am using NDVI for this. Can I use raster calculator to overlay this 2 NDVI maps to create a combined map for them to calculate the area covered for forest? Doesn't that work???
Any advice and what's your opinion on getting a job in GIS in America while working from Sweden (remote)? I'm asking because I want to get started with a career in GIS having both had a part time job, and studies from university and higher vocational education. I already have a job in a different but similar field and i've been on the lookout for something in GIS and I feel like I get really close but in the end there's always someone else that beats me to it. I'm not to sure if it would be possible so would like to hear your thoughts and opinions.
Dear all i have huge amount of georeferenced areal photography (Jpeg) and I woud like to convert them to be one big ecw file. Any ideas? I mostly use ArcGis and Qgis thanks in advance for your help :)
I’m going to be graduating next semester and I have no idea what jobs I am qualified for. I getting my BS in geography and a cert in geospatial analysis. My work experience is an internship with a Big GIS Software company in the Inland Empire California where I tested bugs for a certain software. While I would love to return, I’m looking for jobs in Florida. I really enjoyed my work there doing testing and Enterprise server setup stuff so I’d like to continue doing stuff like that. Also looking for a company that pays well or remote (Florida is expensive!) I was thinking about Motorola Solutions. I’m pretty terrible at making maps and it just doesn’t interest me. My skill set includes: • Esri products (Pro, ArcMap, Pro Extensions, Arc Server) • Programming (Java, MATLAB, Python) • Linux ArcGIS Enterprise setup/upgrading
I'm a cartographer and landed my first job out of undergraduate college. I'm a bit in over my head in terms of basic GIS, which I honestly mostly forgot and am desperately trying to pick back up now. I've been thrown a lot of projects and am kinda expected to be a GIS guru, when I've spent most of my time learning map design and using Adobe illustrator and such. I'm making a parcel map and need to identify commercial business hubs within a county in ArcPro. My thought was to convert the parcels to centroids and run a density analysis of commerical properties in relation to the amount of total properties within a specified radius. I did a feature to point conversion and don't know what tool to use next. Would density based clustering get me what I want? I'm not really sure where to take this to provide a meaningful analysis. Should I factor population density into it? I have a buildings polygon layer and maybe that could that be useful? This is pretty basic stuff, I figure, but I've been bogged down by moving across the country for this first job and am just looking for some thoughts/direction!
I am setting up domain for arcgis portal like arcgisportal.example.com but when I am hitting [https://arcgisportal.example.com/](https://arcgisportal.example.com/) redirecting to IP address but when I am hitting [https://arcgisportal.example.com/arcgis/home](https://arcgisportal.example.com/arcgis/home) it works fine.
Hello! ​ I am following a tutorial to \[re\]learn Python for GIS, specifically following the Python for ArcGIS Pro textbook. This textbook is written with ArcGIS Pro version 2.9 in mind, and Chapter 3 mentions adding the package "rpy2" in the "arcgispro-py3-clone" environment. However, rpy2 never appears in the search query, however there are other options to choose from. I wanted to ensure that I could still follow this chapter as well as use R capabilities in the future if it were to come up. Has rpy2 migrated to something else? I added a few packages that I think could be what I need, but I am not 100% sure I have the correct packages installed. Any documentation I searched did not specify rpy2 not being in the version of ArcGIS Pro I am using nor did I find anything stating it had migrated/changed to something else. Thanks in advance for any help offered! Edit: editing this post to include pictures of the issues I am getting: https://imgur.com/a/V2PuwDD Edit 2: I just realized the images shows the search being performed on the installed packages, however the query on the "Add Packages" tab results in the same failed query for the rpy2 package.
Hi! I’ve been struggling to separate land cover data into layers in global mapper. I’ve connected to the CORINE WMS, but it just loads as one single raster. Since these areas are already classified, I would have thought that I could work with each classification separately, but there dont seems to be any classifications except colors on the downloaded data. I would be very happy if someone could point me in the direction of a place where i can download separated data. I’ve been struggling with this for days, but I just cant do it…
Is there anyway to remove lable layer from osm or another map service
I have 0 background in python or any other programming language as of now, but I want to develop the skills given how useful they will be long term. I'm considering doing the online CS50P course from Harvard to get started since I don't expect to learn much about coding from the classes I'll be taking at my university (although R is covered in at least 2 classes I'll have soon). If I complete the course, generally how capable would that make me in the grand scheme of coding for GIS (i.e. would it even be much of a difference) and what should I plan on doing after if I want to increase my skills? Thanks in advance!
Hello, I'm currently a forester who graduated 6 years ago and I'm thinking of going back to school to take a 1 year accelerated masters in GIS. My two main questions are: 1, how hard to people find it to transfer from a career that uses GIS a little bit to one that focuses on it? Most my experience is collecting and editing GPS data to make maps. 2, how much communication with other people do you usually encounter day to day in your jobs? I'm coming from some isolating jobs and looking for something where I don't go days saying a few sentences to other people. Thanks!
I’m currently a student with a GIS internship. With this comes lots of questions on what GIS is and does. I haven’t found a solid answer for friends and family. What are some of your responses?
Hi! I don't know if this is the right place to ask and if it isn't please help me find it. :) Does anyone here know how to find an SHP file of the world in a very detailed format.? (Like 1:2 or 1:5) It would be good if the file is free and can be used commercially.
I have a collection of raster and polygon vectors layers consisting of DEMs, soil moisture and types etc. I would like to carry out a basic classification of all this information to form 5 groups representing 'forest potentials'. I'm assuming the most straightforward approach is to convert the rasters to polygons, merge the layers into one, then classify that layer into 5 groups?
I am trying to quantify the relationship between the points (green) and the lines (blues) in different layers. I have count data for the points, but it's honestly irrelevant. The voltage class is irrelevant at this point too. Honestly, I'm just trying to determine if they correlate spatially. This is a bird species that is nesting in transmission poles. My working hypothesis is that the poles through this area are allowing the species to expand their breeding range further south. And they really do seem to be preferentially occurring where the transmission lines are (see the second pic for a zoom-in). I made a near table to calculate the distance between each point and its nearest line, then added that data to the point layer's attribute table. I ran a geographically weighted regression, but it was focused on higher counts being closer to the lines, which is not the point. I also don't have ArcPro, so I couldn't run the more appropriate Poisson model or get a p-value. Any ideas on how to determine if these layers are significantly spatially correlated? Like I said, I don't have ArcPro, just ArcMap, but I could use R or QGIS as well. ​ https://preview.redd.it/bscajq1ito6b1.jpg?width=816&format=pjpg&auto=webp&v=enabled&s=530867584e520dbbccbea02221b262667bc9473d ​ https://preview.redd.it/rzbieqsito6b1.png?width=1409&format=png&auto=webp&v=enabled&s=bdb37e38878d6986a0eab9f4004c6ffcc8306cf0
I want to set GeoServer in a machine that will also be hosting a webpage (a web map) and a database (PostgreSQL with PostGIS). Map layers will be stored in the DB, published in Geoserver and served to the Web. I'm between Fedora Server and Ubuntu Server, I use Fedora Workstation as my daily drive, so I feel more leaned to Fedora Server. However I'm still new in the field and this will be my first time setting up a Server, so maybe Ubuntu has more documentation and thus more easy. Any suggestion?
I'm curious if anyone else has experience with tools for editing and collecting data in the field. I'm vaguely aware of QField for QGIS. I believe ESRI has their own tools for that context, but I don't know what they are. I'm also familiar with some tools for a specific industry: namely inspection and data collection for utilities. Some of the ones I know are probably best described as "long in the tooth." What are the options these days? Where do you go for users that need to collect data in the field, whether it's inspection data, correcting existing GIS data, or collecting new data?
Geographic Information Systems
!gis@lemmy.worldAll things GIS (Geographic Information Systems) -- QGIS, ESRI, and more.
Rules:
- Be civil
- Stay on topic
- Job postings should include a pay range